The 5 States Where Most Tracked Rental Markets Still Grew in 2026
Rental-market headlines can sound contradictory.
One report says national single-family rents declined. Another says single-family rents increased in every major metro it tracks. Both statements can be accurate because the reports measure different homes, locations, and periods.
That distinction matters for investors. A national headline can provide context, but it cannot tell you what a specific house, ADU, DADU, or duplex unit in Seattle will rent for.
Here is what the latest data actually shows and how Seattle investors can use it without overestimating future rent growth.
Which five states had the broadest rent growth?
According to Rentometer’s 2026 Mid-Year Single-Family Rental Market Report, a majority of its tracked markets recorded positive year-over-year rent growth in:
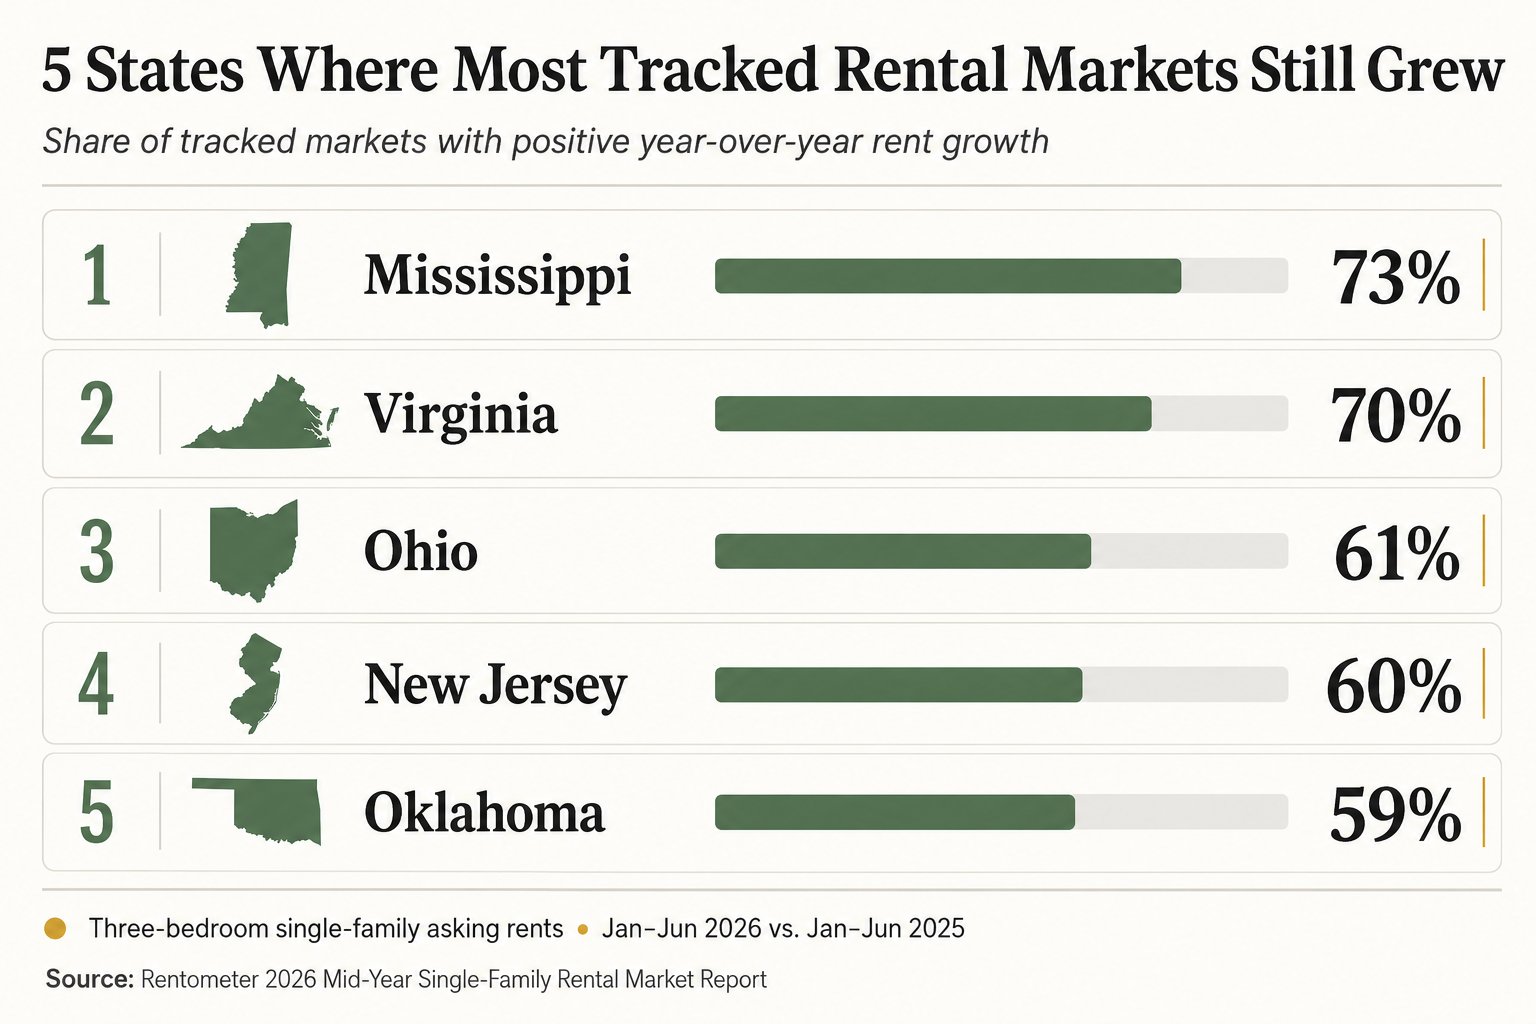
This finding needs an important qualification. Rentometer did not analyze every rental property in each state.
Its report covers advertised asking rents for three-bedroom single-family homes in 1,099 U.S. cities. It compares listings collected from January through June 2026 with the same period in 2025. Cities with fewer than 25 new or updated listings in any quarter were excluded.
Rentometer reported the share of tracked markets with flat or declining rents as 27% in Mississippi, 30% in Virginia, 39% in Ohio, 40% in New Jersey, and 41% in Oklahoma. In other words, most of the tracked markets in those five states posted positive growth.
That is narrower and more accurate than saying rents grew across each entire state.
What did Rentometer find nationally?
Across its dataset, Rentometer reported a national median asking rent of $2,100 for three-bedroom single-family homes during the first half of 2026. That was down 1.6% from the first half of 2025.
The report also found:
- 49% of the 1,099 markets recorded year-over-year rent declines.
- 37% recorded rent growth of at least 1%.
- The remaining markets were flat or grew by less than 1%.
- The national median remained at $2,100 in both the first and second quarters of 2026.
Those findings point to weaker pricing momentum in many local markets. They do not prove that every rental category or every city is declining.
Why does Zillow show a different result?
Zillow’s May 2026 Rental Report reported that the typical U.S. single-family asking rent was $2,291, up 2.8% from a year earlier. Zillow also found year-over-year single-family rent growth in all 50 of the largest metro areas.
Rentometer and Zillow are not measuring the same thing:
Data point | Rentometer | Zillow |
|---|---|---|
Property coverage | Three-bedroom single-family homes | Single-family homes and separate all-rental measures |
Geography | 1,099 cities meeting its listing threshold | The 50 largest metros for its metro comparison |
Metric | Median advertised asking rent | Zillow Observed Rent Index |
Comparison period | First half of 2026 vs. first half of 2025 | May 2026 vs. May 2025 |
This is why investors should compare like with like. A difference in methodology can create a different headline without making either dataset useless.
What do the numbers show for the Seattle metro?
For all rental types not just single-family homes Zillow reported:
Metric | United States | Seattle metro |
Typical asking rent | $1,951 | $2,232 |
Annual change | +2.0% | +1.4% |
Listings offering a concession | 39.6% | 53.1% |
All figures are from May 2026.
This is the correct like-for-like comparison: Seattle metro’s 1.4% annual growth across all rental types versus the national all-rental rate of 2.0%. Seattle metro rents were still growing, but at a slower rate than the national figure. The concession rate also deserves attention. More than half of Seattle-metro listings on Zillow offered some form of incentive.
A concession does not necessarily mean the advertised rent declined. It can mean a free month, reduced move-in cost, or another incentive. But it may reduce the effective rent collected over the lease term.
For example, a landlord advertising $2,400 per month with one free month on a 12-month lease would collect $26,400 before other expenses. Spread across the full lease, that equals an effective monthly rent of $2,200.
That simple adjustment can materially change a property’s projected income.
What does the vacancy data add?
The U.S. Census Bureau estimated the national rental vacancy rate at 7.3% in the first quarter of 2026.
The rate was not statistically different from 7.1% in the first quarter of 2025 or 7.2% in the fourth quarter of 2025. That means the latest data is better described as broadly steady than as evidence of a sudden national shift.
The Census figure covers rental housing nationally. It is useful background, but it is not a substitute for vacancy and leasing conditions in a specific Seattle neighborhood.
What should Seattle investors take from this?
The practical takeaway is not to chase the five states in the headline.
The better takeaway is that rent performance has become more local and more dependent on property type. When growth is modest and concessions are common, a weak rent assumption can erase much of a deal’s expected margin.
Before relying on a projected rent, ask:
- Are the comps the same property type?
- Do they match the bedroom and bathroom count?
- Are condition, parking, utilities, pet policy, and lease length comparable?
- How long have the competing listings been available?
- Are those listings offering concessions?
- Does the deal still work if rent stays flat during the first year?
The highest nearby asking rent is rarely the best starting point. A smaller set of close, well-matched comps is usually more useful than a large set of loosely related listings.
How should investors underwrite rent in a slower market?
Use a range rather than one optimistic number.
Conservative case: Use the lower end of supported local comps. Include realistic vacancy, turnover, repairs, and any concession needed to compete.
Expected case: Use the most comparable current listings and recent leasing evidence. Adjust for differences in condition, parking, utilities, and timing.
Strong case: Model the higher end only if the property has clear advantages and the evidence supports it. Do not use this case to make an otherwise weak acquisition appear workable.
Then compare the results. If the investment only meets its goals in the strong case, the risk is not hidden - it is concentrated in the rent assumption.
Are rents falling everywhere in 2026?
No.
Rentometer found annual declines in nearly half of its tracked three-bedroom single-family markets. Zillow found positive annual single-family rent growth across the 50 largest metros.
The difference comes from the property coverage, geography, methodology, and timeframe of each report. Neither result should be applied directly to a property without local support.
Are Seattle rents still growing?
Zillow reported that typical asking rent across all rental types in the Seattle metro increased 1.4% year over year in May 2026.
That is positive growth, but it does not mean every Seattle neighborhood or rental type grew by the same amount. It also does not account for the full effect of concessions on the income a landlord actually collects.
Should investors assume future rent growth in a pro forma?
Future growth can be included as a scenario, but today’s supported rent should anchor the acquisition analysis.
Testing flat rent, a leasing concession, and a longer vacancy period helps show whether the property works because of its current operations or because of hoped-for future growth.
The bottom line
The five-state result is interesting, but it is not a shortcut for choosing a market or underwriting a property.
The more useful lesson is that broad rental data depends heavily on what is being measured. For Seattle investors, current local comps, realistic concessions, and property-specific expenses matter more than a national ranking.
Seattle metro rent growth remained positive in Zillow’s May 2026 data, but it trailed the national all-rental rate and came with a high share of listings offering concessions. That is a market where disciplined underwriting matters.
Author Bio
Michael Haas is a Seattle real estate agent and investor who built HouseHack Seattle to provide an analytically driven resource for new and experienced investors. He specializes in homes and investment properties with rental-income potential through renovations, ADUs, mother-in-law units, duplexes and triplexes, garage conversions, and other practical housing strategies.
This article is for general educational purposes and is not legal, tax, lending, or investment advice. Rental data and market conditions can change. Property-specific assumptions should be independently verified.
Direct Sources
- Rentometer: 2026 Mid-Year Single-Family Rental Market Report
- Zillow Research: May 2026 Rental Report
- U.S. Census Bureau: First Quarter 2026 Housing Vacancies and Homeownership
- HouseHack Seattle: Michael Haas – Our Story
Follow us on social for updates, tips and event details:
Instagram: @househackseattle
Facebook: HouseHack Seattle
Youtube: @HouseHack Seattle